The DOW Jones stock is a measure of the 30 largest companies in the United States’s stocks. Whether there is a recession or recovery going on, the DOW performance often follows the economic state of the United States. For example, during the most recent Great Recession, the DOW lost more than half of its value, or about 53%, from October 2007 to March 2009. From that point to February 2018, a period that is commonly associated with economic recovery, the DOW went up almost 19,000 points, which is an increase of about 285%.
But now, it has been 19 months since February 2018. And how much has the DOW grown since that time? The increase, over this almost two year stretch of time, is only 7% at a net growth of about 1,700 points. But this displacement makes it sound like the DOW has been stagnant the entirety of these 19 months. The reality is that the stocks have been more tumultuous than ever before.
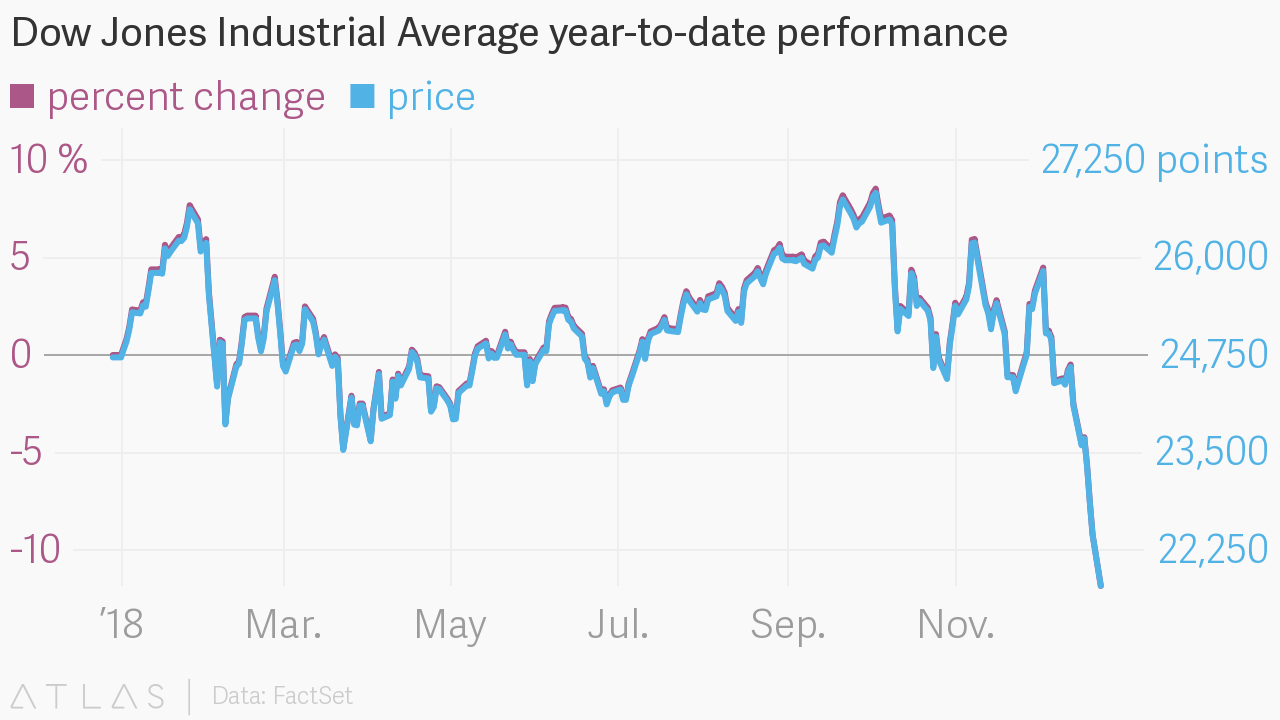
Between December 3rd and December 24th of 2018, the DOW fell by about 4,000 points, or a 16% drop. This pushed the DOW back to 22,445 points, the lowest point it was about a year and a half before that point. It would seem logical that the DOW would then either continue dropping or slowly recover from the drop, but that is not at all what happened. In fact, it took just under two months to completely recover these losses, with the DOW growing 17% by early February.
There is certainly a correlation between the US vs China trade war events and the DOW.
But this growth did not last either. It proceeded to stagnate for three more months until early May when it dropped 1,600 points, or about 7%, over the course of a month. And then what happened? It recovered the losses and then some within a month and a half, with a growth of about 10% at 2,500 points being added.
But of course, this didn’t last either. Within another month, the DOW dropped another 1,600 points with a decrease of 7%. And now, with federal interest rates being cut, the DOW is in the process of recovering again, with a growth of about 5% since then of 1,500 points.
And if we go back earlier to late January 2018, when the DOW had reached a high at the time of 26,616 points, it dropped 2,400 points by 9% over the course of two weeks. And then it stagnated with no end in sight for five months before rallying 1,700 points between July and September 2018, which was when it dropped 2,000 points by 8% between September and October 2018.
What is causing this back and forth shifting? Well, there is certainly a correlation between the US vs China trade war events and the DOW. Whenever tariffs are increased or tensions between the two countries appear to escalate, the DOW tends to take a nosedive even if it is in the process of gaining. But whenever there are reports of talks or negotiations of easing tensions, the DOW will often rally. For example, recently in August this year it was announced that there would be a 15% tariff on Chinese goods. Subsequently, the DOW stagnated during the entirety of the month rather than recover its prior losses from July.
Another factor is US economic reports. Whenever the report or outlook seems to be positive, the DOW tends to rally while a negative report often results in investors pulling out their investments, decreasing the DOW. For example, in late August last year, it was announced that the US economy had yielded a GDP growth of 4.2% in the second quarter, the fastest rate since the third quarter of 2014. And in the following month of September,
the DOW had a positive month where the immediate fallout was a growth of almost 3% with 800 points being added over the course of three weeks.
There are a variety of factors contributing to this DOW stagnation, with no obvious singular factor contributing to most of these drops and rises. It will be very interesting to see how the DOW will perform in the near future.

