By Michael Ge
After the results of the 2020 Census, New York narrowly lost one of its 27 congressional districts. New York will now have 26 congressional districts starting from the 2022 election cycle all the way up to the 2032 election cycle. The district to be eliminated will likely be the 22nd congressional district. It includes the cities of Utica and Binghamton. Donald Trump won the 22nd 54.7% to Joe Biden’s 43.3%. Currently, New York’s congressional delegation consists of 18 Democrats and 9 Republicans. This number will certainly move in favor of the Democrats after the redistricting process.
In the House of Representatives, Democrats hold the narrowest of majorities. They possess, at the time of writing, 220 seats – just two more than the 218 seats required for a majority. The redistricting battle will be key for Democrats with Republicans certainly expected to further gerrymander Texas and Florida. With a tough midterm election coming up in 2022, New York is the strongest advantage the Democrats have to hold their majority.
Although New York voters approved an independent redistricting commission in 2014, the New York State Legislature will certainly take over the process. After the 2020 elections, Democrats possessed the ⅔ majority in both chambers of the state legislature to overrule the commission-drawn congressional maps.
Governor Kathy Hochul was asked in an interview with the New York Times whether or not she would help to expand the Democratic Party’s majority through redistricting, she answered in the affirmative. Hochul, who was drawn into an unfriendly district for the 2012 elections and narrowly lost re-election, now has the chance to draw out up to five Republican representatives in addition to the eliminated district: two on Long Island, one centered on Staten Island, one in Syracuse, and one in Western New York.
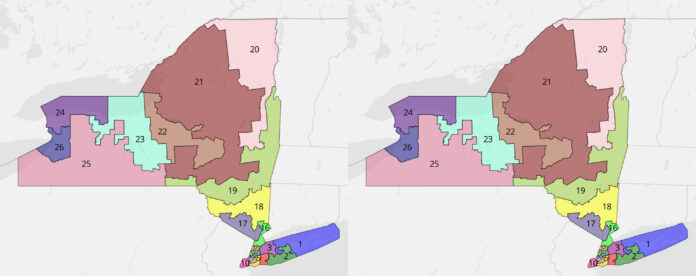
I used DRA 2020, a free redistricting software, to see how New York’s congressional districts could look after the redistricting cycle. All population data was calculated with the results of the 2020 census. All districts were ±1000 people of the target population of 776,971. For election data, the composite 2012-2016 election data, which includes data from the 2012 and 2016 presidential elections, was used since the 2020 results were not yet available at the time of writing. For a local note, the 24th district contains the entirety of Amherst and Williamsville while the 26th contains the entirety of Clarence. Although I previously mentioned that two Republican held districts on Long Island could be drawn to favor Democrats, only one was drawn to favor Democrats since it would be risky for Democrats to draw both to favor them. Below is a list showing the percentages of Democratic or Republican support (based on which party the district favors), the geographic location of the districts, and if they are a majority-minority district along with the largest ethinic group listed. A majority-minority district exists if the adult population of a district is less than 50% non-hispanic white.
1st: Brookhaven and Islip | 51.8% Democratic
2nd: Massapequa Park | 58.6 Republican
3rd: Oyster Bay | 57.1 Democratic
4th: Hempstead | 62.9% Democratic | 44.7% non-hispanic white | 27.5% African American
5th: St. Albans | 86.3% Democratic | 12.8% non-hispanic white | 40% African American
6th: Flushing | 67.1% Democratic | 34.1% non-hispanic white | 40.2% Asian
7th: Canarsie | 71.8% Democratic | 35.2% non-hispanic white | 39.7% African American
8th: Crown Heights | 95.3% Democratic | 27.9% non-hispanic white | 40.7% African American
9th: Flatbush | 75.7 Democratic | 31.7% non-hispanic white | 27.4% African American
10th: Staten Island | 61.3% Democratic
11th: Midtown Manhattan | 84.1% Democratic
12th: Astoria | 84.6% Democratic
13th: University Heights | 95.2% Democratic | 15.8% non-hispanic white | 52% hispanic
14th: Pelham | 83.7% Democratic | 16% non-hispanic white | 47.7% hispanic
15th: Melrose | 93.7% Democratic | 6.8% non-hispanic white | 53.1% hispanic
16th: Yonkers | 66.2% Democratic | 48.6% non-hispanic white | 26.2% hispanic
17th: Stony Point | 55.4% Democratic
18th: Poughkeepsie | 52.9% Democratic
19th: Albany and Binghamton | 56.3% Democratic
20th: Schenectady | 55.1% Democratic
21st: Watertown and Rome | 59.5% Republican
22nd: Syracuse and Utica | 55.8% Democratic
23rd: Ithaca | 55.4% Democratic
24th: Rochester and Niagara Falls | 55% Democratic
25th: Batavia and Elmira | 61.1% Republican
26th: Buffalo | 56.5% Democratic
